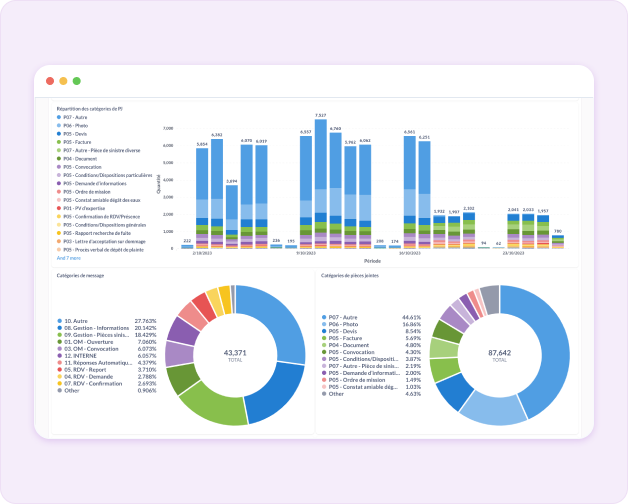


Manage your flows in real time and monitor your performance through the tracking of key indicators.
Cockpit is more than a dashboard—it’s a true control tool that enables you to act faster and optimize your internal processes.
Repérez immédiatement toute hausse ou baisse anormale d’activité.
Dimensionnez vos équipes en temps réel pour une gestion optimale.
Analysez les tendances et optimisez l’organisation de vos opérations.
Exportez et partagez vos rapports en un seul clic.
Number of messages analyzed, success rate, or processing time —
Identify trends, refine your strategy, and continuously improve your customer service.
Monitor solution rollouts in real time at entity or group level.Identify opportunities and boost your ROI.
React quickly to changes in your flow. If your flow increases or decreases over an hour, a day, or a week, you receive an email alert so you can respond immediately. If an analysis takes too long, you are notified to handle the request manually.
Don’t let your resources go to waste. Get an at-a-glance view of your usage and make informed decisions.
Bring an environmental dimension into your project management. Assess the carbon footprint of your initiatives and make more responsible choices.
Export your data in .xlsx, .csv, or .json formats to integrate it seamlessly into your own tools.
View the real-time status of each subsidiary—those already active and those yet to be launched. Prioritize your actions to avoid underutilizing resources and accelerate deployment across all teams.
Relevance rates naturally fluctuate—and that’s expected. Our monitoring dashboard shows how they evolve over time and helps you anticipate optimization phases.
Discover how our customers use Cockpit to optimize their operations and gain efficiency.
A customer in the retail industry noticed that the number of messages categorized as “Quote Request” was twice as high as those categorized as “Order” over the same period.
They were able to adjust resource allocation by increasing the number of agents in the “Quote Request” team.
For another e-commerce player, the dashboard revealed twice as many orders as quotes, leading to a reinforcement of the order management team.
The tool enabled a logistics company to anticipate demand peaks and optimize its deliveries.
An insurance company identified strong demand for a specific coverage, allowing it to adjust its offerings accordingly.
Try our explainable, efficient, and reliable AI today.
Sign up to receive the latest updates from Miralia.